
Файл:Kscaleprojections.png
Оригинален файл (1115 × 647 пиксела, големина на файла: 23 КБ, MIME-тип: image/png)
| Този файл е от Общомедия и може да се използва от други проекти.
Следва информация за файла, достъпна през оригиналната му описателна страница. |
Резюме
| Описание |
Русский: Шкала Кардашева
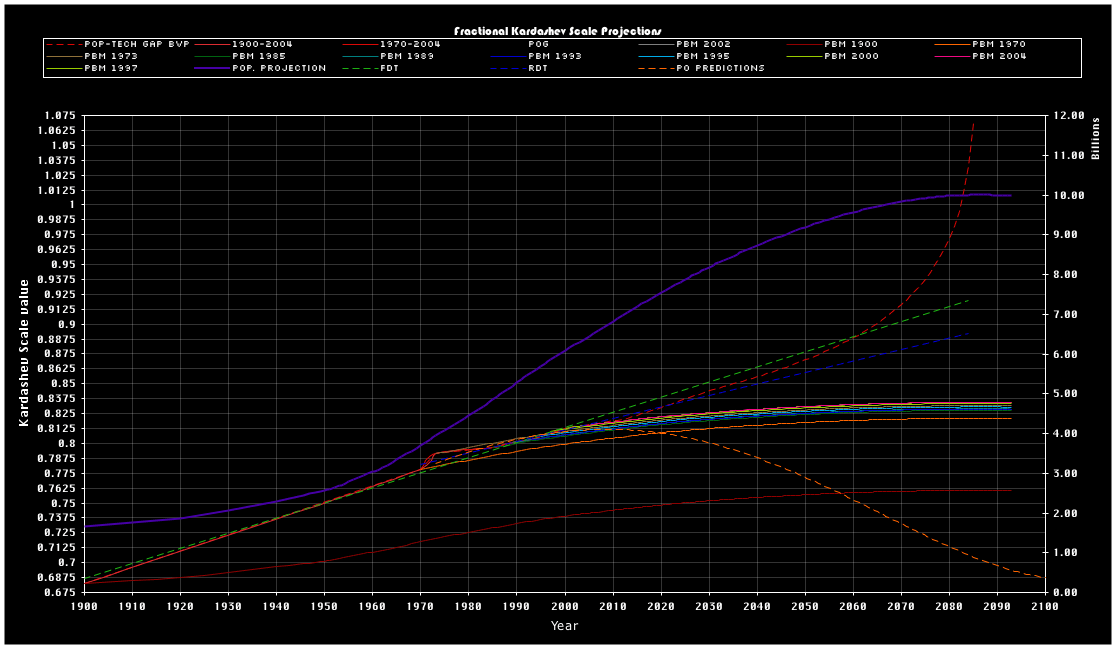
English: An image of Kardashev scale projections ranging from 1900 to 2100. The projections are off by 0.1 on the kardashev scale. This is graphed against the supportable population and given growth against the supposed technology growth associated the kardashev scale. Projections are made by different ratios of energy production to technology growth for a given level of energy (and technology) against predicted population growth, and new technology production and new energy production needed to support a given population, and the growth of such population. In some projections, if energy production is unable to keep up with population growth, technology levels fall. In some projections, as population growth slows, supposedly increased technology can be produced via the lower amount of energy needed to sustain population growth.
Outside comment : It appears much of the data were taken from International Energy Agency, World Energy Outlook 2005, pg. 82, according to User:Sparkygravity. The following is an incomplete legend of lines plotted, with completeness to follow once all original acronyms can be deciphered:
Note that there are no units given for any such plots, though the population projection probably aligns on the right and another user has suggested that the energy "PBM" scales are converted from IEA data on the left. This makes the combination of logarithmic and linear vertical scales, as well as population and energy scales, on the same axis questionable at best, but more likely useless and confusing, and therefore should likely be cleaned up if this image is to retain any usability. Many articles and reproductions online (notably Technological Singularity have vastly misinterpreted this graph in thinking that all lines are Kardashev-scale projections, which has been shown to not be the case. Only the dense cluster of lines are projections relevant to the left-hand Kardashev scale. It is therefore recommended that captions be changed and this image not be used further in any encyclopedia articles for ongoing ambiguity, original research, and confusion in plotting. |
| Дата | 7 юли 2005 (original upload date) |
| Източник | Прехвърлен от en.wikipedia към Общомедия. |
| Автор | Ctrl build at английски Уикипедия |
Лицензиране

|
Предоставя се разрешение за копиране, разпространение и/или модификация на този документ според Лиценза за свободна документация на ГНУ, в своята версия 1.2 или някоя следваща версия, издадена от Фондацията за свободен софтуер; без непроменими раздели, без текст на предната подвързия и без текст на задната подвързия. Копие на този лиценз е приложено в раздела Лиценз за свободна документация на ГНУ. |
| Този файл се разпространява под лиценз Криейтив Комънс Признание — Споделяне на споделеното 3.0. | ||
| Признание: Ctrl build at английски Уикипедия | ||
| ||
| This licensing tag was added to this file as part of the GFDL licensing update. |
- Можете свободно:
- да споделяте – да копирате, разпространявате и излъчвате произведението
- да ремиксирате – да адаптирате произведението
- Съгласно следните условия:
- признание на авторството – Трябва да посочите авторството, да добавите връзка към лиценза и да посочите дали са правени промени. Можете да направите това по всякакъв разумен начин, но не и по начин, оставящ впечатлението, че същият/същите подкрепят вас или използването по някакъв начин на творбата от вас.
- споделяне на споделеното – В случай, че промените, видоизмените или използвайки като основа произведението, го надградите, то полученото производно произведение може да се разпространява само съгласно условията на същия или съвместим лиценз с оригиналния такъв.
Дневник на оригиналното качване
- 2008-02-01 07:29 Xiong Chiamiov 1115×647× (23395 bytes) optimized using optipng
- 2005-07-07 18:59 Ctrl build 1115×647× (28801 bytes) An image of Kardashev scale projections ranging from 1900 to 2100. The projections are off by 0.1 on the kardashev scale. This is graphed against the supportable population and given growth against the supposed technology growth associated the the kardash
История на файла
Избирането на дата/час ще покаже как е изглеждал файлът към онзи момент.
| Дата/Час | Миникартинка | Размер | Потребител | Коментар | |
|---|---|---|---|---|---|
| текуща | 21:13, 27 юни 2012 | | 1115 × 647 (23 КБ) | OgreBot | (BOT): Reverting to most recent version before archival |
| 21:13, 27 юни 2012 |  | 1115 × 647 (28 КБ) | OgreBot | (BOT): Uploading old version of file from en.wikipedia; originally uploaded on 2005-07-07 18:59:33 by Ctrl build | |
| 08:03, 18 февруари 2012 |  | 1115 × 647 (23 КБ) | BPK | {{BotMoveToCommons|ru.wikipedia|year={{subst:CURRENTYEAR}}|month={{subst:CURRENTMONTHNAME}}|day={{subst:CURRENTDAY}}}} The upload bot is User:CommonsHelper2 Bot which is called by [http://toolserver.org/~commonshelper2/index.php CommonsHelper2]. The t |
Използване на файла
Следната страница използва следния файл:
Глобално използване на файл
Този файл се използва от следните други уикита:
- Употреба в be.wikipedia.org
- Употреба в en.wikipedia.org
- Употреба в tr.wikipedia.org