
Файл:2014 militrary expenditures absolute.svg

Размер на този PNG предварителен преглед на изходния SVG файл: 512 × 288 пиксела. Други разделителни способности: 320 × 180 пиксела | 640 × 360 пиксела | 1024 × 576 пиксела | 1280 × 720 пиксела | 2560 × 1440 пиксела.
Оригинален файл (Файл във формат SVG, основен размер: 512 × 288 пиксела, големина на файла: 1,52 МБ)
| Този файл е от Общомедия и може да се използва от други проекти.
Следва информация за файла, достъпна през оригиналната му описателна страница. |
Резюме
| Описание |
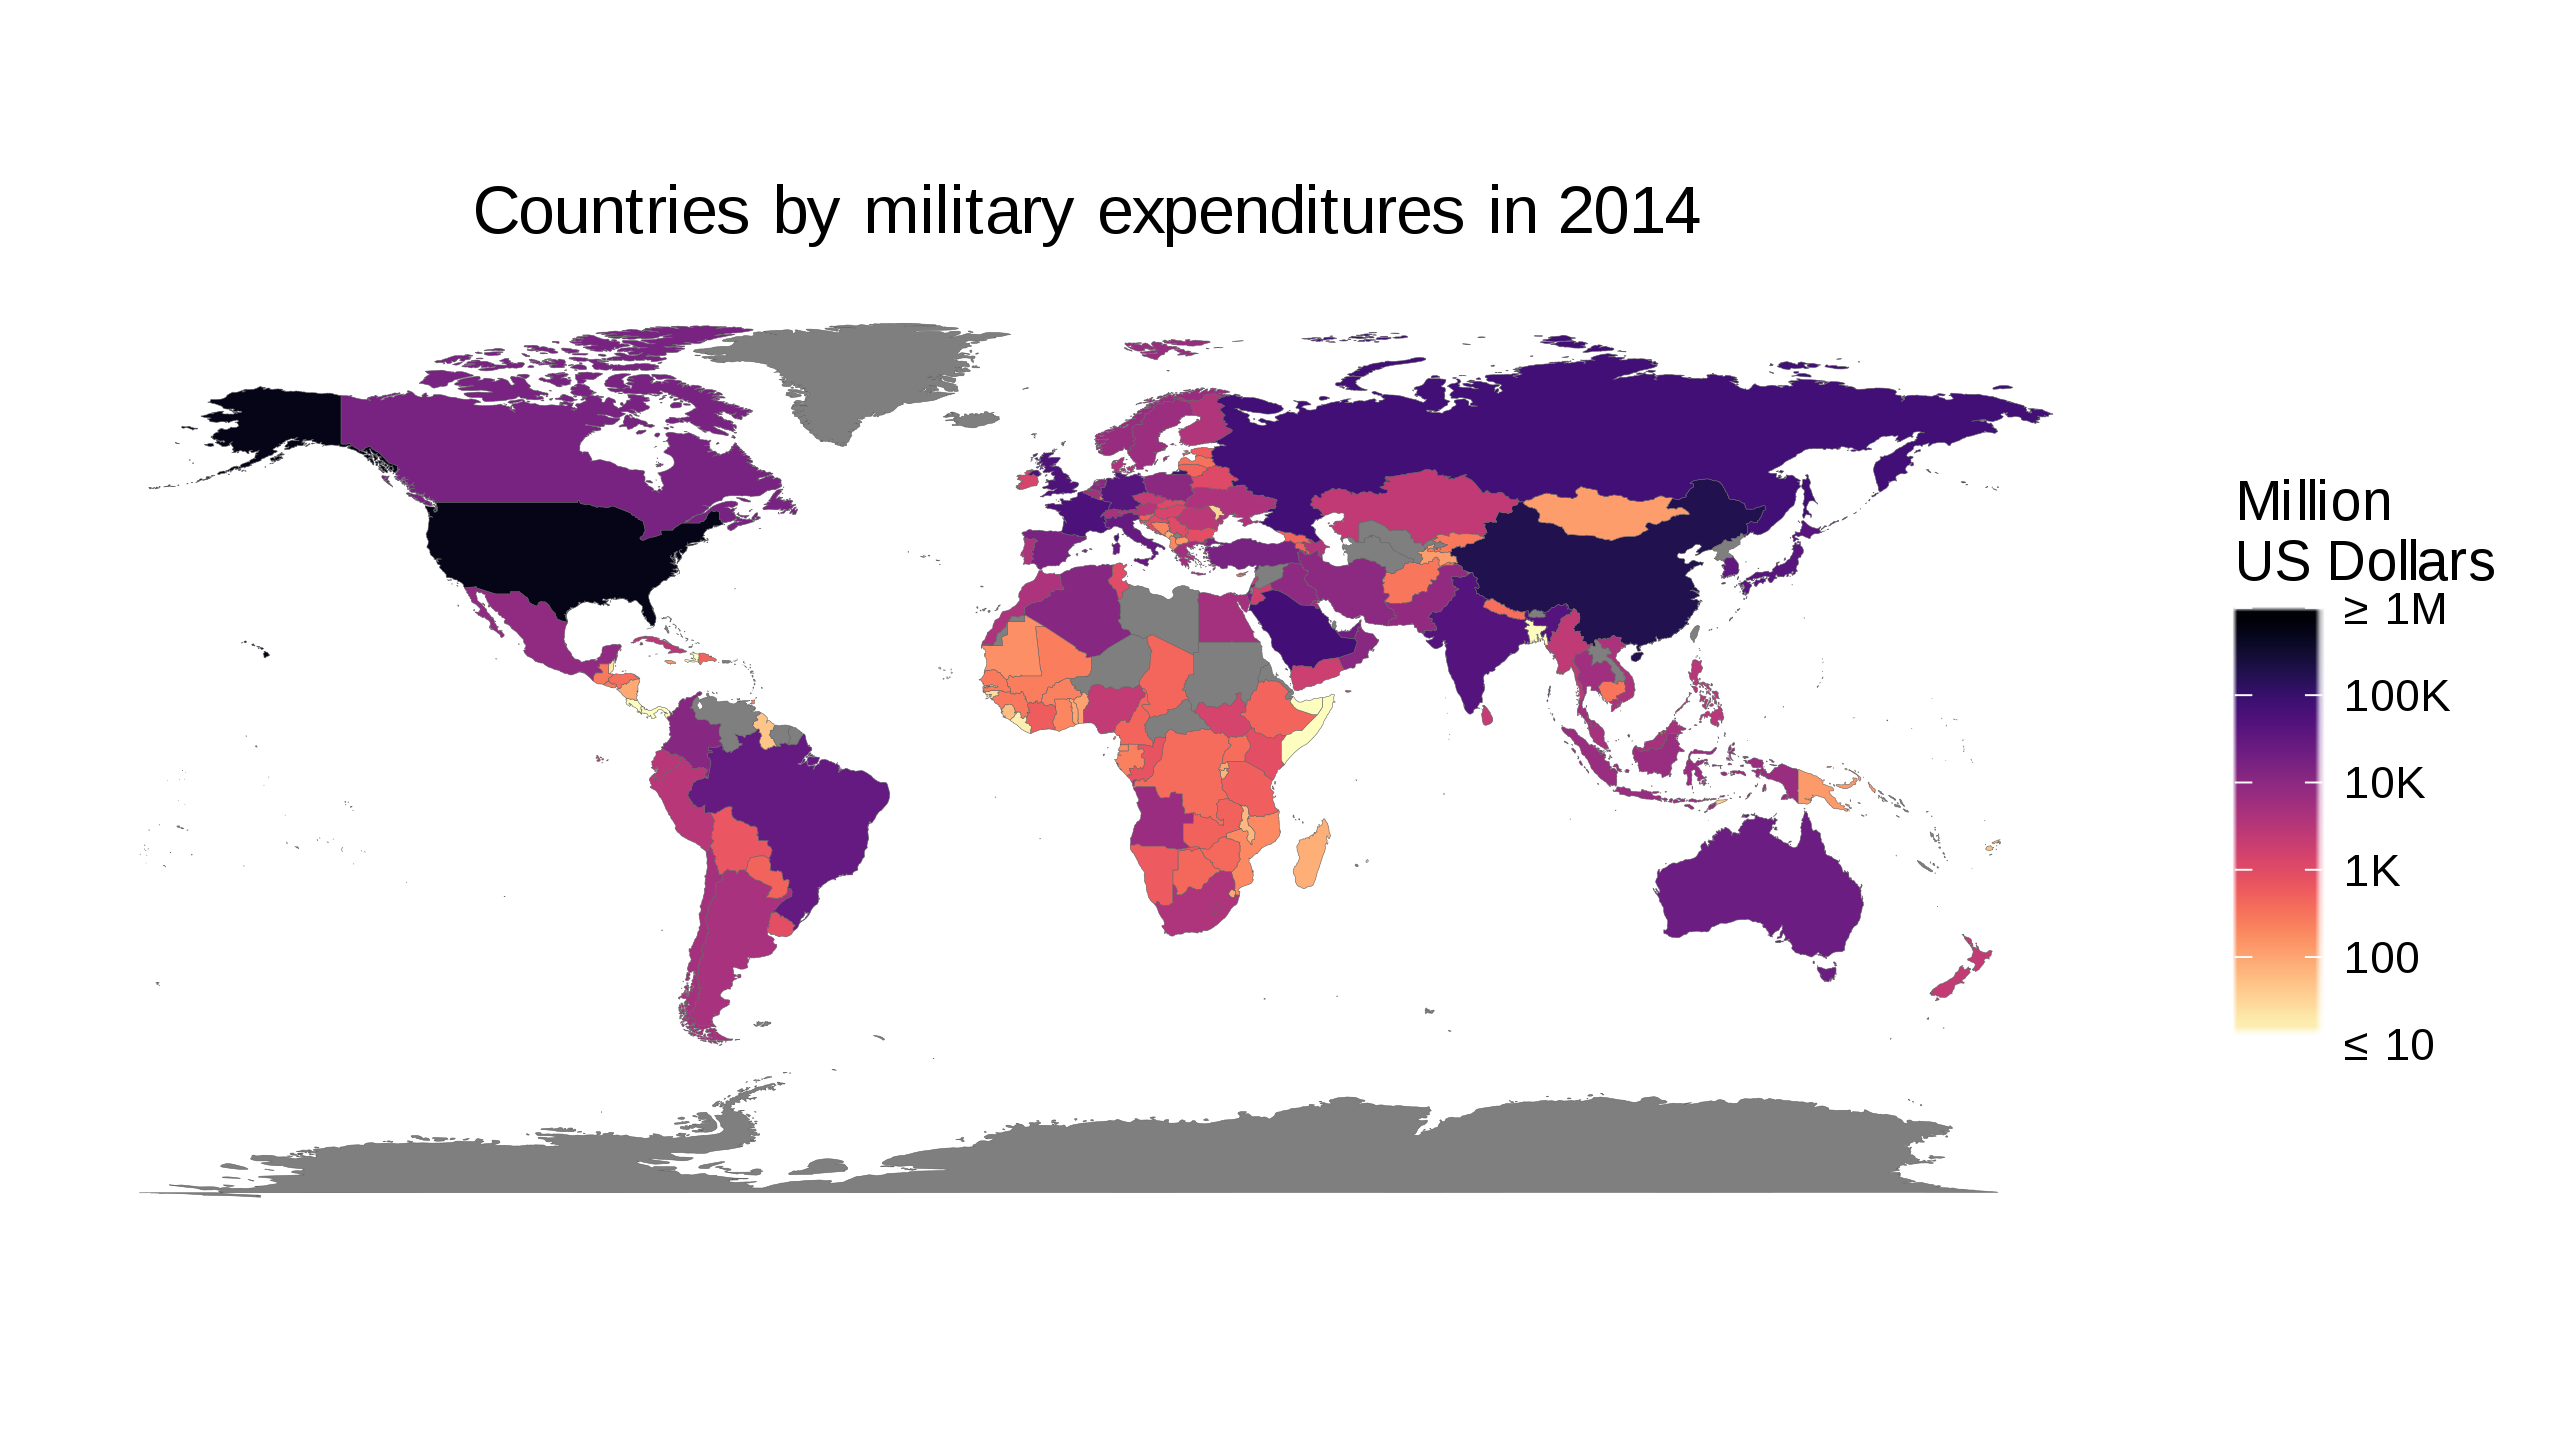
English: Based on the Worldbank data from http://data.worldbank.org/indicator/MS.MIL.XPND.GD.ZS and http://data.worldbank.org/indicator/NY.GDP.MKTP.CD This is a candidate for replacing/augmenting https://commons.wikimedia.org/wiki/File:Countries_by_Military_expenditures_(%25_of_GDP)_in_2014_v2.svg |
| Източник | Собствена творба |
| Автор | Pipping |
_in_2014_v2.svg)
Лицензиране
Аз, носителят на авторските права над тази творба, я публикувам тук под следния лиценз:
This file is licensed under the Creative Commons Attribution-Share Alike 4.0 International license.
- Можете свободно:
- да споделяте – да копирате, разпространявате и излъчвате произведението
- да ремиксирате – да адаптирате произведението
- Съгласно следните условия:
- признание на авторството – Трябва да посочите авторството, да добавите връзка към лиценза и да посочите дали са правени промени. Можете да направите това по всякакъв разумен начин, но не и по начин, оставящ впечатлението, че същият/същите подкрепят вас или използването по някакъв начин на творбата от вас.
- споделяне на споделеното – В случай, че промените, видоизмените или използвайки като основа произведението, го надградите, то полученото производно произведение може да се разпространява само съгласно условията на същия или съвместим лиценз с оригиналния такъв.
Created with the following piece of code:
library(magrittr)

selectedYear <- 2014

getWorldBankData <- function(indicatorCode, indicatorName) {
    baseName <- paste('API', indicatorCode, 'DS2_en_csv_v2', sep='_')
    ## Download zipfile if necessary
    zipfile <- paste(baseName, 'zip', sep='.')
    if (!file.exists(zipfile)) {
        zipurl <- paste(paste('http://api.worldbank.org/v2/en/indicator',
                              indicatorCode, sep='/'),
                        'downloadformat=csv', sep='?')
        download.file(zipurl, zipfile)
    }
    csvfile <- paste(baseName, 'csv', sep='.')
    ## This produces a warning because of the trailing commas. Safe to ignore.
    readr::read_csv(unz(zipfile, csvfile), skip=4,
                    col_types = list(`Indicator Name` = readr::col_character(),
                                     `Indicator Code` = readr::col_character(),
                                     `Country Name` = readr::col_character(),
                                     `Country Code` = readr::col_character(),
                                     .default = readr::col_double())) %>%
        dplyr::select(-c(`Indicator Name`, `Indicator Code`, `Country Name`))
}

## Obtain and merge World Bank data
worldBankData <-
    dplyr::left_join(
               getWorldBankData('MS.MIL.XPND.GD.ZS') %>%
               tidyr::gather(-`Country Code`, convert=TRUE,
                             key='Year', value=`Military expenditure (% of GDP)`,
                             na.rm = TRUE),
               getWorldBankData('NY.GDP.MKTP.CD') %>%
               tidyr::gather(-`Country Code`, convert=TRUE,
                             key='Year', value=`GDP (current US$)`,
                             na.rm = TRUE)) %>%
    dplyr::mutate(`Military expenditure (current $US)` =
                      `Military expenditure (% of GDP)`*`GDP (current US$)`/100) %>%
    dplyr::filter(Year == selectedYear) %>%
    dplyr::mutate(Year = NULL)

## Plotting: Obtain Geographic data
mapData <- tibble::as.tibble(ggplot2::map_data("world")) %>%
    dplyr::mutate(`Country Code` =
                      countrycode::countrycode(region, "country.name", "iso3c"),
                  ## This produces a warning but I do not see how we could do better
                  ## since we started with fuzzy names.
                  region = NULL, subregion = NULL)

combinedData <- dplyr::left_join(mapData, worldBankData)

## The default out-of-bounds function `censor` replaces values outside
## the range with NA. Since we have properly labelled the legend, we can
## project them onto the boundary instead
clamp <- function(x, range = c(0, 1)) {
    lower <- range[1]
    upper <- range[2]
    ifelse(x > lower, ifelse(x < upper, x, upper), lower)
}

ggplot2::ggplot(data = combinedData, ggplot2::aes(long,lat)) +
    ggplot2::geom_polygon(ggplot2::aes(group = group,
                                       fill  = `Military expenditure (current $US)`),
                          color = '#606060', lwd=0.05) +
    ggplot2::scale_fill_gradientn(colours= rev(viridis::magma(256, alpha = 0.5)),
                                  name   = "Million\nUS Dollars",
                                  trans  = "log",
                                  oob    = clamp,
                                  breaks = c(1e7,1e8,1e9,1e10,1e11,1e12),
                                  labels = c('\u2264 10', '100', '1K',
                                             '10K', '100K', '\u2265 1M'),
                                  limits = c(1e7,1e12)) +
    ggplot2::coord_fixed() +
    ggplot2::theme_bw() +
    ggplot2::theme(plot.title = ggplot2::element_text(hjust = 0.5),
          axis.title = ggplot2::element_blank(),
          axis.text = ggplot2::element_blank(),
          axis.ticks = ggplot2::element_blank(),
          panel.grid.major = ggplot2::element_blank(),
          panel.grid.minor = ggplot2::element_blank(),
          panel.border = ggplot2::element_blank(),
          panel.background = ggplot2::element_blank()) +
    ggplot2::labs(title = paste("Countries by military expenditures in",
                                selectedYear))

ggplot2::ggsave(paste(selectedYear, 'militrary_expenditures_absolute.svg', sep='_'),
                height=100, units='mm')
История на файла
Избирането на дата/час ще покаже как е изглеждал файлът към онзи момент.
| Дата/Час | Миникартинка | Размер | Потребител | Коментар | |
|---|---|---|---|---|---|
| текуща | 14:30, 20 май 2017 | | 512 × 288 (1,52 МБ) | Pipping | redo with dplyr |
| 12:12, 13 май 2017 |  | 512 × 256 (1,51 МБ) | Pipping | Handle truncation of the data range better: We distinguish between 0 and no data, but any existing datum below 10M USD is coloured the same way and all data above 1T USD are coloured the same way. The legend makes this clear. | |
| 08:55, 13 май 2017 |  | 512 × 256 (1,51 МБ) | Pipping | Completely redone. The former was in local currency (so that comparisons from country to country made absolutely no sense). Now everything is in current US dollars. | |
| 22:32, 11 май 2017 |  | 512 × 256 (1,5 МБ) | Pipping | Fixed min/max value for colors that kept anything below 1,000,000,000 US dollars from having a colour (now: Anything above 1,000,000 US dollars has a colour). | |
| 21:30, 11 май 2017 |  | 512 × 256 (1,51 МБ) | Pipping | {{Information |Description ={{en|1=English: Based on the Worldbank data from http://data.worldbank.org/indicator/MS.MIL.XPND.CN This is a candidate for replacing/augmenting https://commons.wikimedia.org/wiki/File:Countries_by_Military_expenditures_(... |
Използване на файла
Следната страница използва следния файл:
Глобално използване на файл
Този файл се използва от следните други уикита:
- Употреба в ca.wikipedia.org
- Употреба в en.wikipedia.org
- Употреба в eu.wikipedia.org
- Употреба в sr.wikipedia.org
- Употреба в th.wikipedia.org
- Употреба в uk.wikipedia.org