
Файл:E12 values graph.svg

Оригинален файл (Файл във формат SVG, основен размер: 575 × 420 пиксела, големина на файла: 4 КБ)
| Този файл е от Общомедия и може да се използва от други проекти.
Следва информация за файла, достъпна през оригиналната му описателна страница. |
Резюме
| Описание |
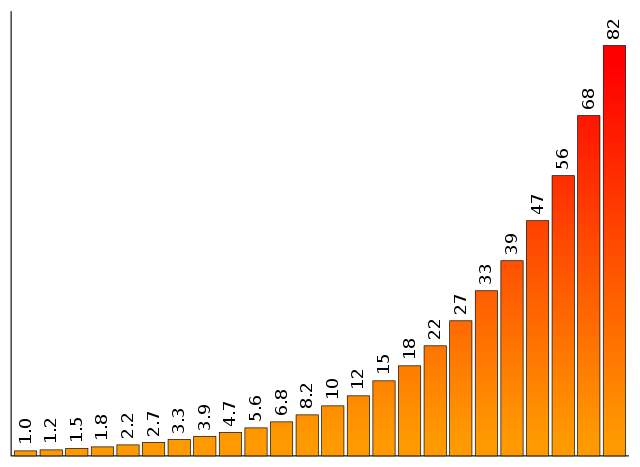
English: Graph showing values of the E12 series, which is used to standardize values of resistors and capacitors. The values shown cover two decades of the series, from 1 to 82, and illustrate the exponential nature of the series. |
| Дата | |
| Източник | Own work by uploader, designed to replace original bitmap image Image:E12_values_graph.png |
| Автор | Qef |
| други версии | Bitmap version showing the same data, but with superfluous labels, making it not language neutral: Image:E12_values_graph.png |
Лицензиране
| Тази творба е публикувана от своя автор, Qef, като обществено достояние. Това разрешение е в сила за целия свят. В някои държави това може да не е възможно от законодателна гледна точка; затова: |
Source code
This graph was generated by the Perl program below, which was specially written for the purpose. If changes need to be made, it's probably best to tweak the program and re-run it to get a new version, rather than editing the SVG directly.
use warnings;
use strict;

# The E12 series twice over, the first time divided by 10.
my @VALUES = qw(
    1.0 1.2 1.5 1.8 2.2 2.7 3.3 3.9 4.7 5.6 6.8 8.2
    10  12  15  18  22  27  33  39  47  56  68  82
);

# Parameters to set appearance.
my $AXIS_HT = 400;
my $VERT_SCALE = 4.5;
my $BAR_WIDTH = 20;
my $BAR_GAP = 3;
my $MARGIN = 10;

my $img_wd = ($BAR_WIDTH + $BAR_GAP) * @VALUES + $BAR_GAP + 2 * $MARGIN;
my $img_ht = $AXIS_HT + 2 * $MARGIN;
my $margin_right = $img_wd - $MARGIN;
my $margin_bottom = $img_ht - $MARGIN;

my $x = $MARGIN;
my $graph_path = '';
my $text_cmds = '';
for (@VALUES) {
    $x += $BAR_GAP;
    my $bar_ht = $_ * $VERT_SCALE;
    $graph_path .= "M$x,$margin_bottom v-$bar_ht h$BAR_WIDTH v$bar_ht Z\n";
    $x += $BAR_WIDTH;
    my $bar_top = $img_ht - $bar_ht - $MARGIN + -5;
    my $txt_x = $x - 0.5 * $BAR_WIDTH + 4.5;
    $text_cmds .= "  <text transform='translate($txt_x,$bar_top) rotate(270)'" .
                  " x='0' y='0' fill='#000' text-anchor='start'>$_</text>\n";
}

print <<"END";
<?xml version="1.0" encoding="UTF-8"?>
<svg version="1.0" width="$img_wd" height="$img_ht"
     xmlns="http://www.w3.org/2000/svg">

 <defs>
  <linearGradient id="grad" x2="0%" y1="0%" y2="100%">
   <stop offset="5%" stop-color="#F00" />
   <stop offset="95%" stop-color="#F90" />
  </linearGradient>
 </defs>

 <path stroke="#000" stroke-width="1" fill="none"
       d="M$MARGIN,$MARGIN V$margin_bottom H$margin_right"/>
 <path stroke="#000" stroke-width="0.6" fill="url(#grad)" d="$graph_path"/>
 <path stroke="#333" stroke-width="0.6" fill="url(#grad)" d="$graph_path">
 </g>
</svg>
END
История на файла
Избирането на дата/час ще покаже как е изглеждал файлът към онзи момент.
| Дата/Час | Миникартинка | Размер | Потребител | Коментар | |
|---|---|---|---|---|---|
| текуща | 17:07, 3 юли 2008 | | 575 × 420 (4 КБ) | Qef | {{Information |Description={{en|1=Graph showing values of the E12 series, which is used to standardize values of resistors and capacitors. The values shown cover two decades of the series, from 1 to 82, and illustrates the exponential nature of the serie |
Използване на файла
Следната страница използва следния файл:
Глобално използване на файл
Този файл се използва от следните други уикита:
- Употреба в da.wikipedia.org
- Употреба в de.wikipedia.org
- Употреба в en.wikipedia.org
- User:Augur
- User:VinceyB
- User:Simen 88
- User:NekrosKoma
- User:Masterhomer
- Wikipedia:Userboxes/Philosophy
- User:MaesterTonberry
- User:Java7837/userboxing/Singularitarian
- User:Saukkomies/My userboxes
- User:Vaerinn
- User:Keskival
- User:Test35965
- User:Elsa-and-Anya
- User:ImmortalRationalist
- User:KiefKief
- User:AnnonJung
- User:Thablaqkgoat
- User:FrederickII
- E series of preferred numbers
- User:AllanVolt
- User:Just an ordinary human
- User:HeyTomek
- User:Berkay123456789
- Употреба в en.wikiversity.org
- Употреба в eo.wikipedia.org
- Употреба в et.wikipedia.org
- Употреба в he.wikipedia.org
- Употреба в uk.wikipedia.org
- Употреба в zh.wikipedia.org