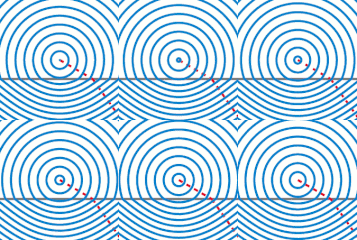
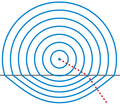
Файл:Snells law wavefronts.gif

Съдържанието на страницата не се поддържа на други езици.
от Уикипедия, свободната енциклопедия

Snells_law_wavefronts.gif(225 × 227 пиксела, големина на файла: 65 КБ, MIME-тип: image/gif, зациклен, 10 кадъра, 0,1 сек)

Емблемата на Общомедия Този файл е от Общомедия и може да се използва от други проекти.

Следва информация за файла, достъпна през оригиналната му описателна страница.

Titel

Резюме

 
This diagram was created with MATLAB.
Описание
English: Illustration of wavefronts in the context of Snell's law.
Дата (UTC)
Източник Own work, created with MATLAB. (Source code below.)
Автор Oleg Alexandrov
Права
(Повторно използване на файла)
Public domain Аз, носителят на авторските права над тази творба, я публикувам като обществено достояние. Това разрешение е в сила за целия свят.
В някои държави това може да не е възможно от законодателна гледна точка; затова:
Давам на всекиго правото да използва тази творба за всякакви цели, без никакви условия, освен ако такива условия съществуват по закон.
други версии
File:Snells law wavefronts.svg е векторна версия на този файл. Тя следва да бъде използвана на мястото на това растерно изображения, в случай, че не е ниш.

File:Snells law wavefronts.gif → File:Snells law wavefronts.svg

За повече информация, вижте Help:SVG.

На други езици
Alemannisch  Bahasa Indonesia  Bahasa Melayu  British English  català  čeština  dansk  Deutsch  eesti  English  español  Esperanto  euskara  français  Frysk  galego  hrvatski  Ido  italiano  lietuvių  magyar  Nederlands  norsk bokmål  norsk nynorsk  occitan  Plattdüütsch  polski  português  português do Brasil  română  Scots  sicilianu  slovenčina  slovenščina  suomi  svenska  Tiếng Việt  Türkçe  vèneto  Ελληνικά  беларуская (тарашкевіца)  български  македонски  нохчийн  русский  српски / srpski  татарча/tatarça  українська  ქართული  հայերեն  বাংলা  தமிழ்  മലയാളം  ไทย  한국어  日本語  简体中文  繁體中文  עברית  العربية  فارسی  +/−
Ново SVG изображение

Source code

% Illustration of Snell's law
function main()

   % indexes of refraction
   n1=1.0;
   n2=1.5;

   sign = -1;% is the source up or down?
   O=[0, -1*sign];
   k=500;

   
% KSmrq's colors
   red    = [0.867 0.06 0.14];
   blue   = [0, 129, 205]/256;
   green  = [0, 200,  70]/256;
   yellow = [254, 194,   0]/256;
   white = 0.99*[1, 1, 1];
   black = [0, 0, 0];
   gray = 0.5*white;

   color1=red;
   color2=blue;
   color3=gray;
   lw = 3;
   
   plot_line=0;
   Theta=linspace(0, 2*pi, k);
   V=0*Theta; W=0*Theta;
   S0=7;
   spacing=0.45;
   p=floor(S0/spacing);
   S=linspace(0, S0, p+1);
   spacing=S(2)-S(1);
   
   num_frames = 10;
   for frame_iter=1:num_frames

      figure(1); clf; hold on; axis equal; axis off;

      % plot the interface between diellectrics
      L=1.2*S0;
      plot([-L, L], [0, 0], 'color', color3, 'linewidth', lw);
      
      
      % plot a ray
      plot_line=1;
      s=L;
      theta=pi/3; wfr(s, theta, n1, n2, O, sign, plot_line, color1, lw);

      % plot the wafefronts
      plot_line=0;
      for i=1:p

	 s=S(i)+spacing*(frame_iter-1)/num_frames;

	 for j=1:k
	    theta=Theta(j);
	    [V(j), W(j)]=wfr(s, theta, n1, n2, O, sign, plot_line, color1, lw);
	 end
	 plot(V, W, 'color', color2, 'linewidth', lw);
      end
      

      %  dummy points to enlarge the bounding box
      plot(0, S0+2.5*spacing, '*', 'color', white);
      plot(0, -(S0+2.5*spacing)/n2, '*', 'color', white);

      % to know where to crop later
      Lx=3.2; Ly=Lx; shift = 1;
      plot([-Lx, Lx, Lx, -Lx -Lx], ...
           [-Ly, -Ly, Ly, Ly, -Ly]+shift);

      file = sprintf('Frame%d.eps', 1000+frame_iter);
      disp(file);
      saveas(gcf, file, 'psc2')
   end
end

% Converted to gif with the UNIX command
% convert -density 100 -antialias Frame10* Snell_animation.gif 
% then cropped in Gimp

function [a, b]=wfr(s, theta, n1, n2, O, sign, plot_line, color1, lw);

   X=O+s*[sin(theta), sign*cos(theta)];

  if( sign*X(2) > 0 )
    t=-sign*O(2)/cos(theta);
    X0=O+t*[sin(theta), sign*cos(theta)];
    
    if (plot_line == 1) 
      plot([O(1), X0(1)], [O(2), X0(2)], 'color', color1, 'linewidth', lw, 'linestyle', '--');
    end

    d = norm(O-X0);
    r = (s-d)*(n2/n1)^(sign);

    theta2=asin(n1*sin(theta)/n2);
    XE=X0+r*[sin(theta2), sign*cos(theta2)];
  else
    XE = X;
  end  
  a = XE(1);
  b = XE(2); 

  if (plot_line==1)
    plot([X0(1), XE(1)], [X0(2), XE(2)], 'color', color1, 'linewidth', lw, 'linestyle', '--');
  end  
end

Описания

Add a one-line explanation of what this file represents
Wavefronts from a point source of light.In a particuler wavefront u will see that the dist btw source & wavefront above the line is > dist btw source & wavefront below the line beacuse lightspeed is greater in the above and lower in below.

Items portrayed in this file

изобразен обект

Някаква стойност без обект в Уикиданни

История на файла

Избирането на дата/час ще покаже как е изглеждал файлът към онзи момент.

Дата/ЧасМиникартинкаРазмерПотребителКоментар
текуща09:59, 5 юли 2009Миникартинка на версията към 09:59, 5 юли 2009225 × 227 (65 КБ)Capmoreduced to 16 colors with no quality loss
06:31, 2 януари 2008Миникартинка на версията към 06:31, 2 януари 2008225 × 227 (148 КБ)Oleg Alexandrov{{Information |Description=Illustration of wavefronts in the context of Snell's law. |Source=self-made with MATLAB |Date=05:36, 1 January 2008 (UTC) |Author= Oleg Alexandrov |Permission= |oth

Следната страница използва следния файл:

Глобално използване на файл

Този файл се използва от следните други уикита:

Преглед на глобалната употреба на файла.